Interpretable Causal ML
Causal ML provides methods to interpret the treatment effect models trained, where we provide more sample code in feature_interpretations_example.ipynb notebook.
Meta-Learner Feature Importances
from causalml.inference.meta import BaseSRegressor, BaseTRegressor, BaseXRegressor, BaseRRegressor
slearner = BaseSRegressor(LGBMRegressor(), control_name='control')
slearner.estimate_ate(X, w_multi, y)
slearner_tau = slearner.fit_predict(X, w_multi, y)
model_tau_feature = RandomForestRegressor() # specify model for model_tau_feature
slearner.get_importance(X=X, tau=slearner_tau, model_tau_feature=model_tau_feature,
normalize=True, method='auto', features=feature_names)
# Using the feature_importances_ method in the base learner (LGBMRegressor() in this example)
slearner.plot_importance(X=X, tau=slearner_tau, normalize=True, method='auto')
# Using eli5's PermutationImportance
slearner.plot_importance(X=X, tau=slearner_tau, normalize=True, method='permutation')
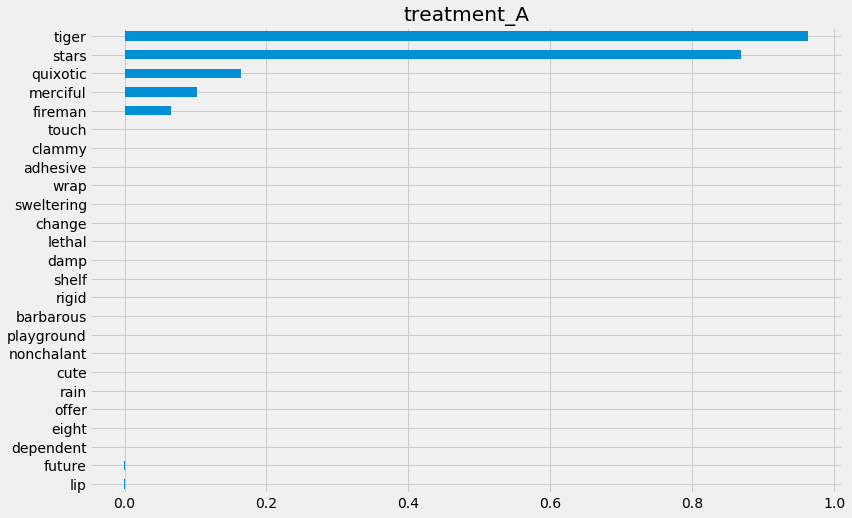
# Using SHAP
shap_slearner = slearner.get_shap_values(X=X, tau=slearner_tau)
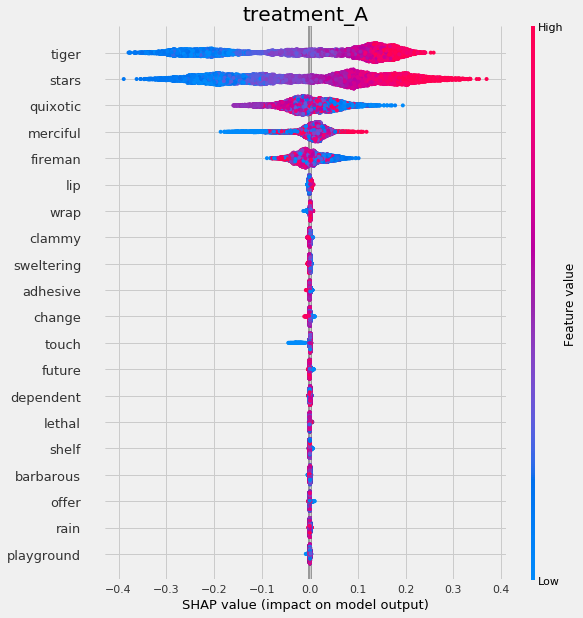
# Plot shap values without specifying shap_dict
slearner.plot_shap_values(X=X, tau=slearner_tau)
# Plot shap values WITH specifying shap_dict
slearner.plot_shap_values(X=X, shap_dict=shap_slearner)
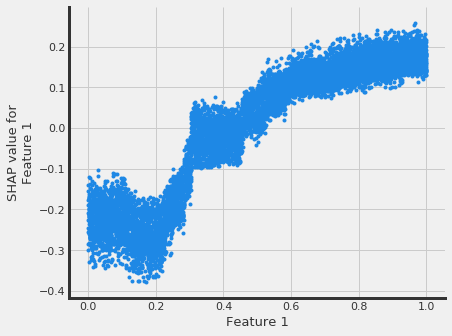
# interaction_idx set to 'auto' (searches for feature with greatest approximate interaction)
slearner.plot_shap_dependence(treatment_group='treatment_A',
feature_idx=1,
X=X,
tau=slearner_tau,
interaction_idx='auto')
Uplift Tree Visualization
from IPython.display import Image
from causalml.inference.tree import UpliftTreeClassifier, UpliftRandomForestClassifier
from causalml.inference.tree import uplift_tree_string, uplift_tree_plot
from causalml.dataset import make_uplift_classification

df, x_names = make_uplift_classification()
uplift_model = UpliftTreeClassifier(max_depth=5, min_samples_leaf=200, min_samples_treatment=50,
                                    n_reg=100, evaluationFunction='KL', control_name='control')

uplift_model.fit(df[x_names].values,
                treatment=df['treatment_group_key'].values,
                y=df['conversion'].values)

graph = uplift_tree_plot(uplift_model.fitted_uplift_tree, x_names)
Image(graph.create_png())
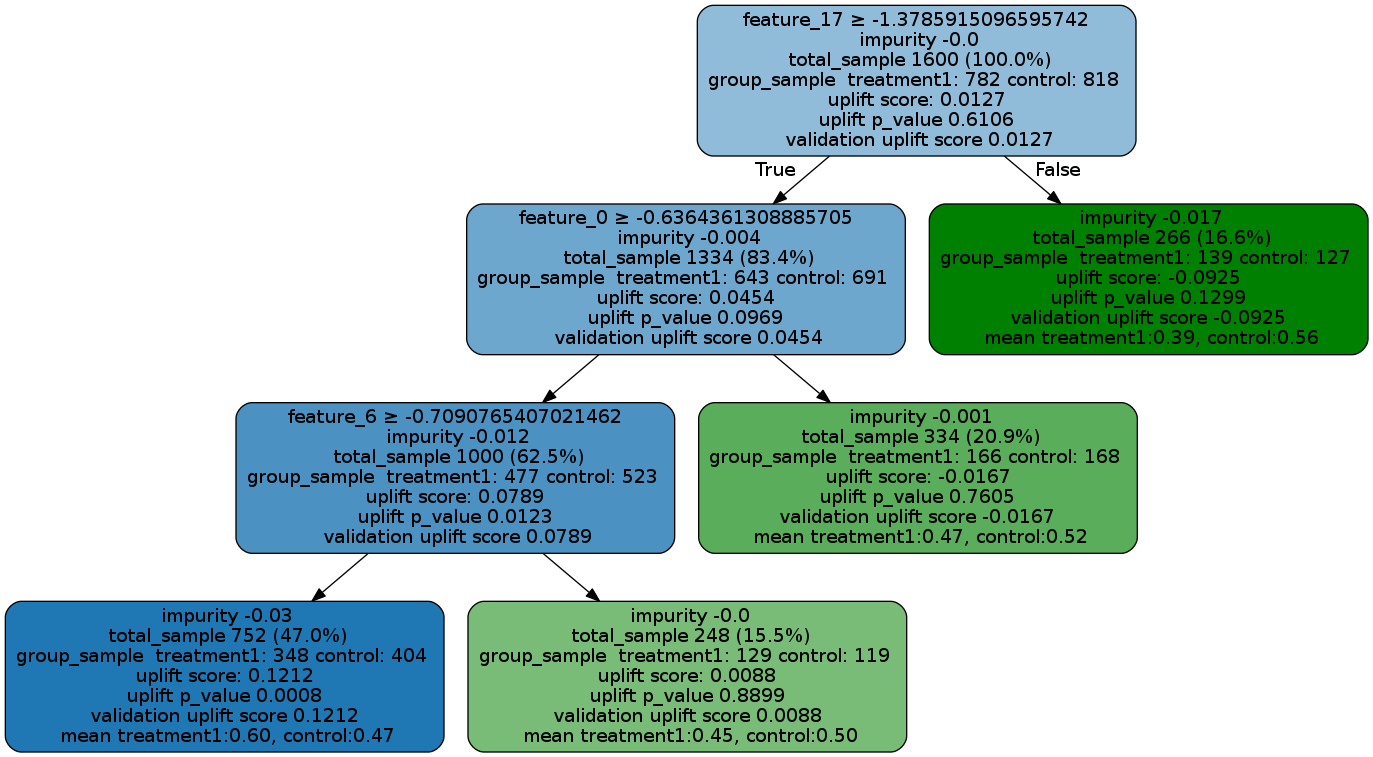
Please see below for how to read the plot, and uplift_tree_visualization.ipynb example notebook is provided in the repo.
feature_name > threshold: For non-leaf node, the first line is an inequality indicating the splitting rule of this node to its children nodes.
impurity: the impurity is defined as the value of the split criterion function (such as KL, Chi, or ED) evaluated at this current node
total_sample: sample size in this node.
group_sample: sample sizes by treatment groups
uplift score: treatment effect in this node, if there are multiple treatment, it indicates the maximum (signed) of the treatment effects across all treatment vs control pairs.
uplift p_value: p value of the treatment effect in this node
validation uplift score: all the information above is static once the tree is trained (based on the trained trees), while the validation uplift score represents the treatment effect of the testing data when the method fill() is used. This score can be used as a comparison to the training uplift score, to evaluate if the tree has an overfitting issue.
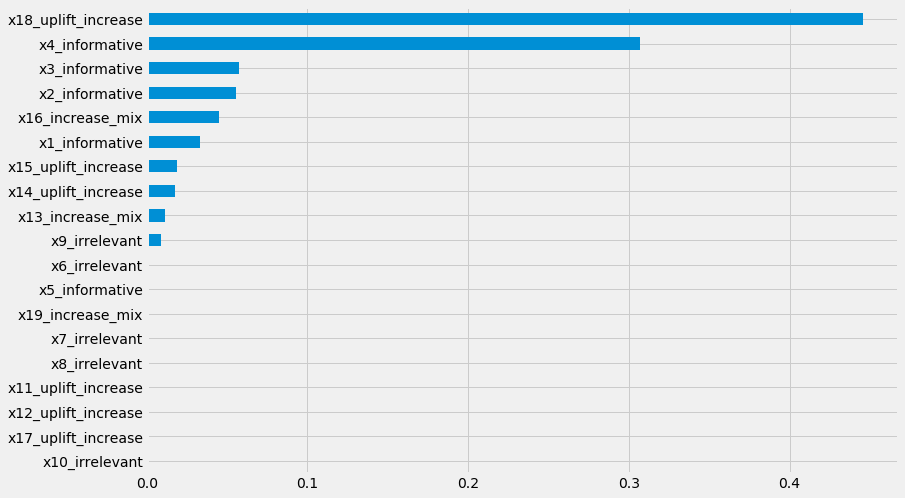
Uplift Tree Feature Importances
pd.Series(uplift_model.feature_importances_, index=x_names).sort_values().plot(kind='barh', figsize=(12,8))