Uplift Trees/Forests Visualization
Introduction
This example notebooks illustrates how to visualize uplift trees for interpretation and diagnosis.
Supported Models
These visualization functions work only for tree-based algorithms:
Uplift tree/random forests on KL divergence, Euclidean Distance, and Chi-Square
Uplift tree/random forests on Contextual Treatment Selection
Currently, they are NOT supporting Meta-learner algorithms
S-learner
T-learner
X-learner
R-learner
Supported Usage
This notebook will show how to use visualization for:
Uplift Tree and Uplift Random Forest
Visualize a trained uplift classification tree model
Visualize an uplift tree in a trained uplift random forests
Training and Validation Data
Visualize the validation tree: fill the trained uplift classification tree with validation (or testing) data, and show the statistics for both training data and validation data
One Treatment Group and Multiple Treatment Groups
Visualize the case where there are one control group and one treatment group
Visualize the case where there are one control group and multiple treatment groups
Step 1 Load Modules
[1]:
from causalml.dataset import make_uplift_classification
from causalml.inference.tree import UpliftTreeClassifier, UpliftRandomForestClassifier
from causalml.inference.tree import uplift_tree_string, uplift_tree_plot
[2]:
import numpy as np
import pandas as pd
from IPython.display import Image
from sklearn.model_selection import train_test_split
One Control + One Treatment for Uplift Classification Tree
[3]:
# Data generation
df, x_names = make_uplift_classification()

# Rename features for easy interpretation of visualization
x_names_new = ['feature_%s'%(i) for i in range(len(x_names))]
rename_dict = {x_names[i]:x_names_new[i] for i in range(len(x_names))}
df = df.rename(columns=rename_dict)
x_names = x_names_new

df.head()

df = df[df['treatment_group_key'].isin(['control','treatment1'])]

# Look at the conversion rate and sample size in each group
df.pivot_table(values='conversion',
               index='treatment_group_key',
               aggfunc=[np.mean, np.size],
               margins=True)
[3]:
| mean | size | |
|---|---|---|
| conversion | conversion | |
| treatment_group_key | ||
| control | 0.5110 | 1000 |
| treatment1 | 0.5140 | 1000 |
| All | 0.5125 | 2000 |
[4]:
# Split data to training and testing samples for model validation (next section)
df_train, df_test = train_test_split(df, test_size=0.2, random_state=111)

# Train uplift tree
uplift_model = UpliftTreeClassifier(max_depth = 4, min_samples_leaf = 200, min_samples_treatment = 50, n_reg = 100, evaluationFunction='KL', control_name='control')

uplift_model.fit(df_train[x_names].values,
                 treatment=df_train['treatment_group_key'].values,
                 y=df_train['conversion'].values)
[5]:
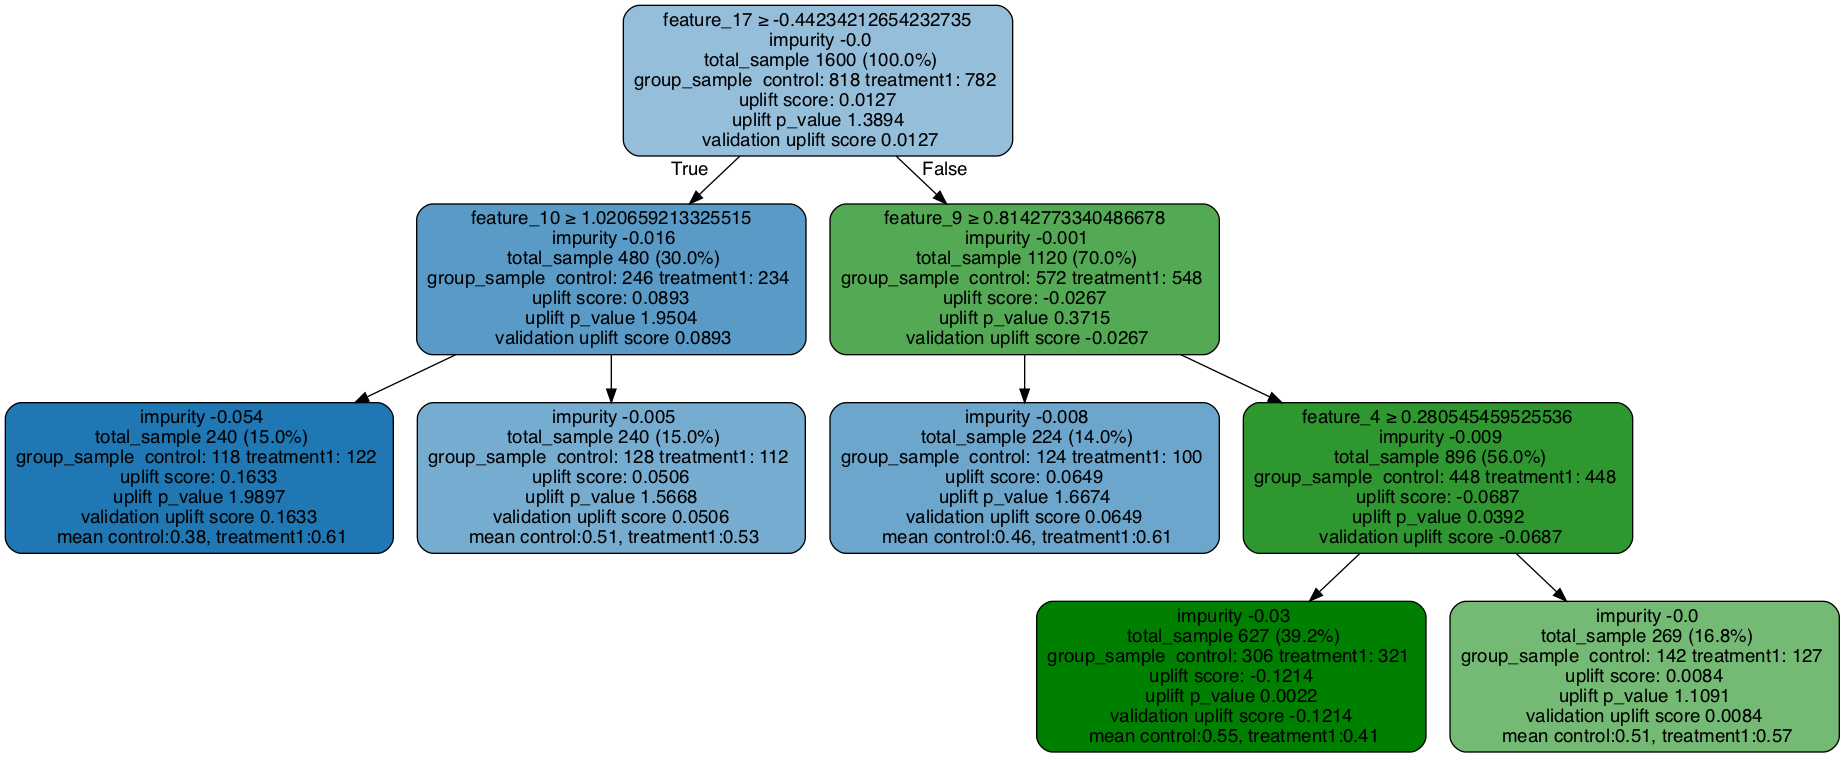
# Print uplift tree as a string
result = uplift_tree_string(uplift_model.fitted_uplift_tree, x_names)
feature_17 >= -0.44234212654232735?
yes -> feature_10 >= 1.020659213325515?
                yes -> [0.3813559322033898, 0.6065573770491803]
                no  -> [0.5078125, 0.5267857142857143]
no  -> feature_9 >= 0.8142773340486678?
                yes -> [0.4596774193548387, 0.61]
                no  -> feature_4 >= 0.280545459525536?
                                yes -> [0.5522875816993464, 0.4143302180685358]
                                no  -> [0.5070422535211268, 0.5748031496062992]
Read the tree
First line: node split condition
impurity: the value for the loss function
total_sample: total sample size in this node
group_sample: sample size by treatment group
uplift score: the treatment effect between treatment and control (when there are multiple treatment groups, this is the maximum of the treatment effects)
uplift p_value: the p_value for the treatment effect
validation uplift score: when validation data is filled in the tree, this reflects the uplift score based on the - validation data. It can be compared with the uplift score (for training data) to check if there are over-fitting issue.
[6]:
# Plot uplift tree
graph = uplift_tree_plot(uplift_model.fitted_uplift_tree,x_names)
Image(graph.create_png())
[6]:
Visualize Validation Tree: One Control + One Treatment for Uplift Classification Tree
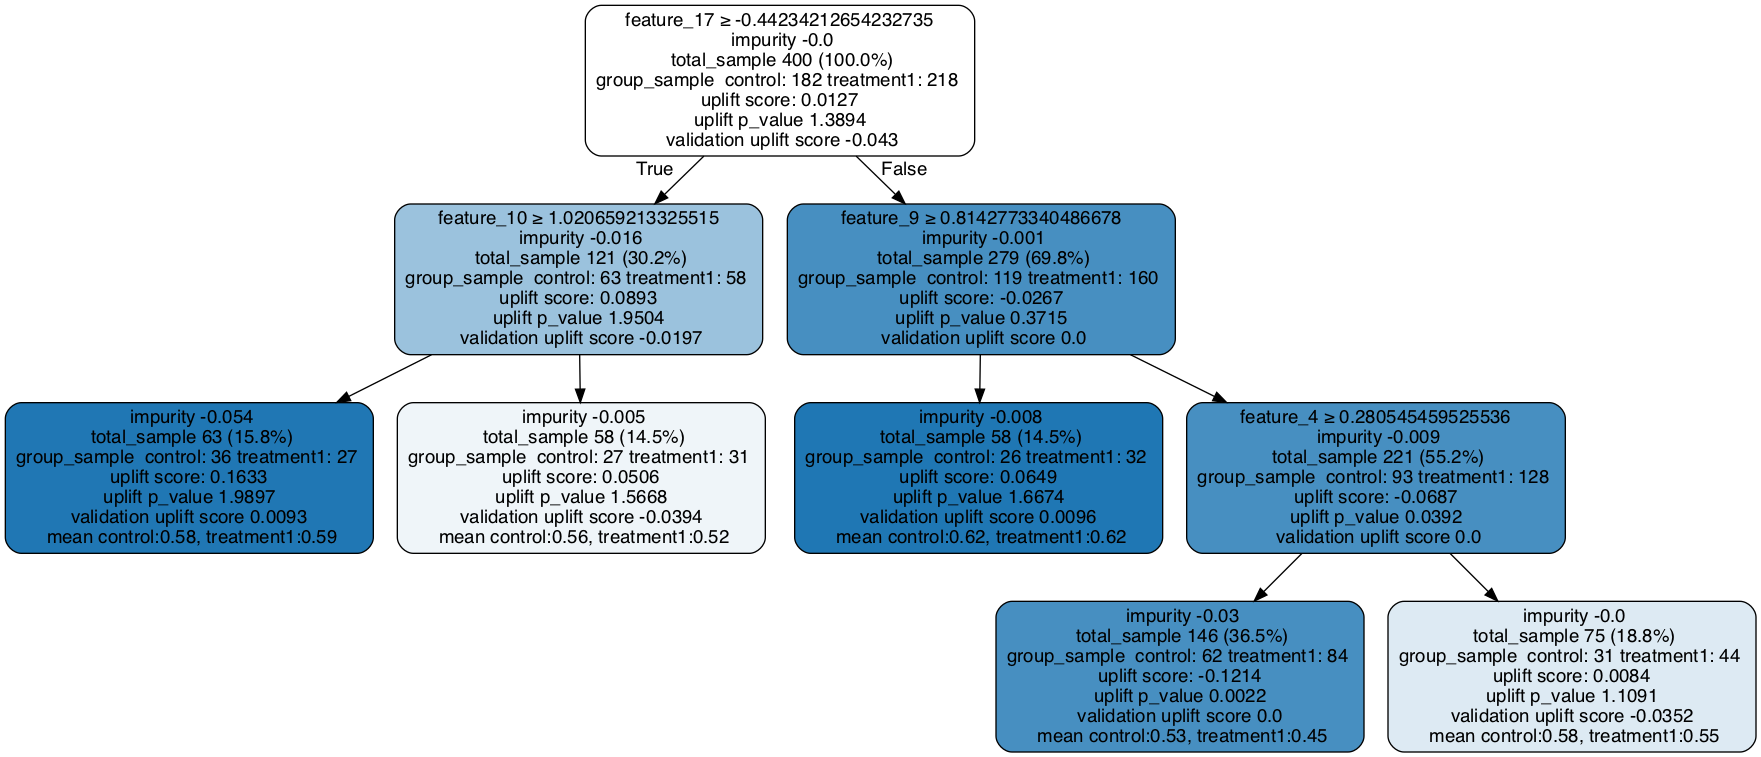
Note the validation uplift score will update.
[7]:
### Fill the trained tree with testing data set
# The uplift score based on testing dataset is shown as validation uplift score in the tree nodes
uplift_model.fill(X=df_test[x_names].values, treatment=df_test['treatment_group_key'].values, y=df_test['conversion'].values)

# Plot uplift tree
graph = uplift_tree_plot(uplift_model.fitted_uplift_tree,x_names)
Image(graph.create_png())
[7]:
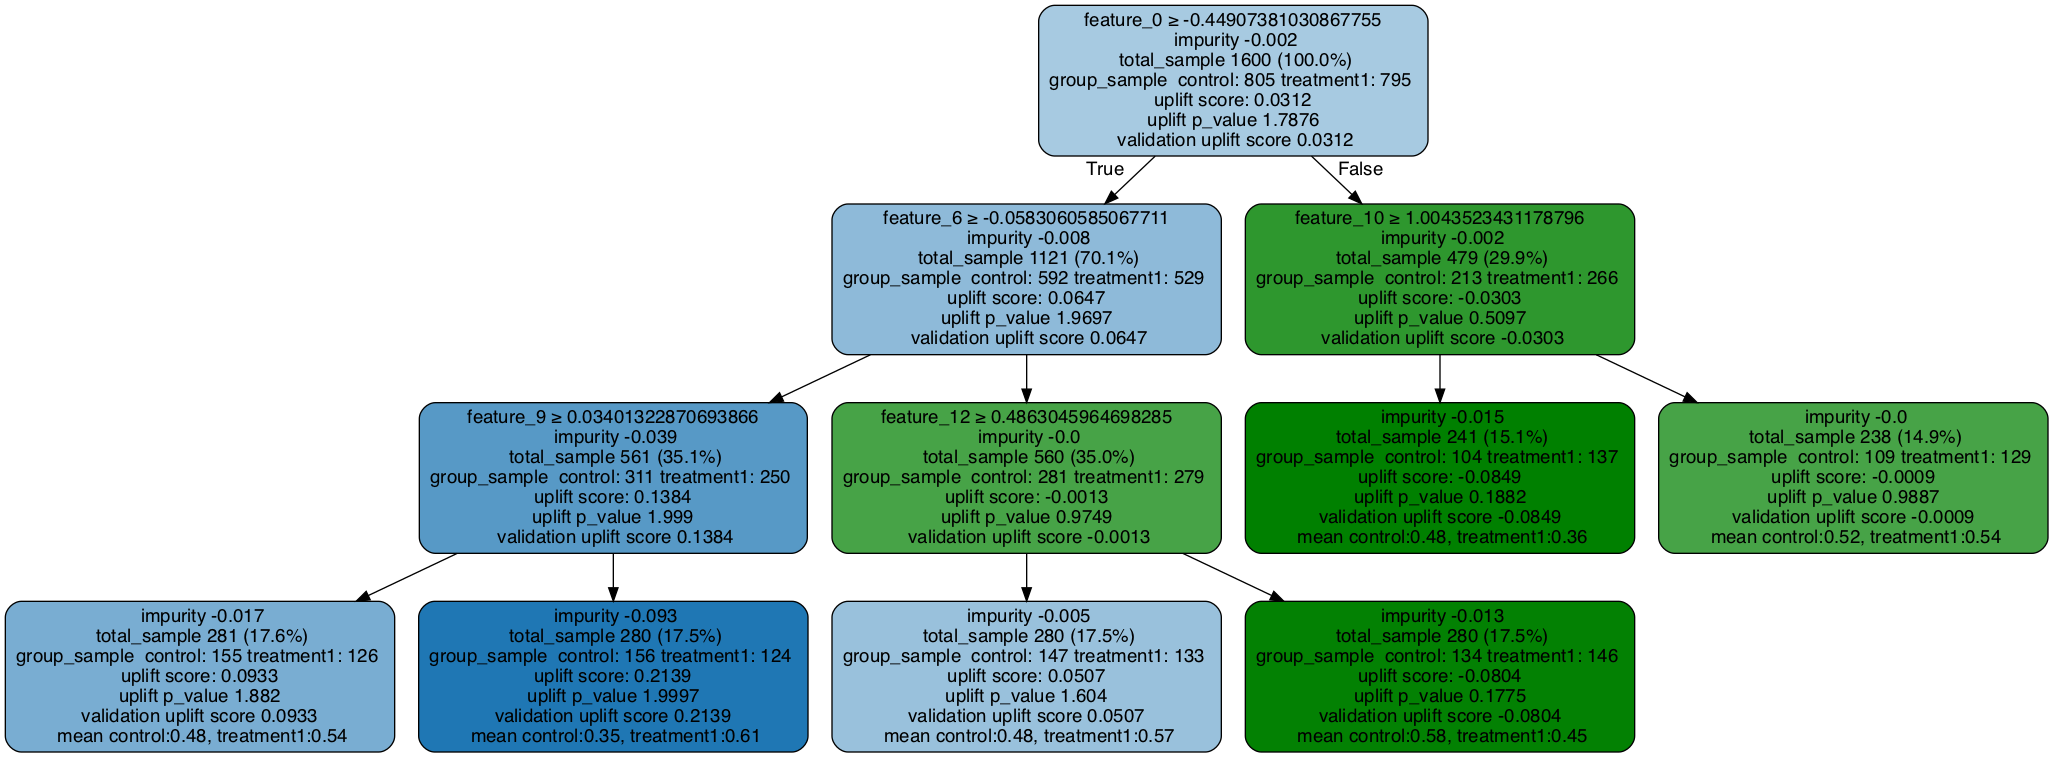
Visualize a Tree in Random Forest
[8]:
# Split data to training and testing samples for model validation (next section)
df_train, df_test = train_test_split(df, test_size=0.2, random_state=111)

# Train uplift tree
uplift_model = UpliftRandomForestClassifier(n_estimators=5, max_depth = 5, min_samples_leaf = 200, min_samples_treatment = 50, n_reg = 100, evaluationFunction='KL', control_name='control')

uplift_model.fit(df_train[x_names].values,
                 treatment=df_train['treatment_group_key'].values,
                 y=df_train['conversion'].values)
[9]:
# Specify a tree in the random forest (the index can be any integer from 0 to n_estimators-1)
uplift_tree = uplift_model.uplift_forest[0]
# Print uplift tree as a string
result = uplift_tree_string(uplift_tree.fitted_uplift_tree, x_names)
feature_0 >= -0.44907381030867755?
yes -> feature_6 >= -0.0583060585067711?
                yes -> feature_9 >= 0.03401322870693866?
                                yes -> [0.4774193548387097, 0.5396825396825397]
                                no  -> [0.34615384615384615, 0.6129032258064516]
                no  -> feature_12 >= 0.4863045964698285?
                                yes -> [0.48299319727891155, 0.5714285714285714]
                                no  -> [0.582089552238806, 0.4452054794520548]
no  -> feature_10 >= 1.0043523431178796?
                yes -> [0.4807692307692308, 0.35766423357664234]
                no  -> [0.5229357798165137, 0.5426356589147286]
[10]:
# Plot uplift tree
graph = uplift_tree_plot(uplift_tree.fitted_uplift_tree,x_names)
Image(graph.create_png())
[10]:
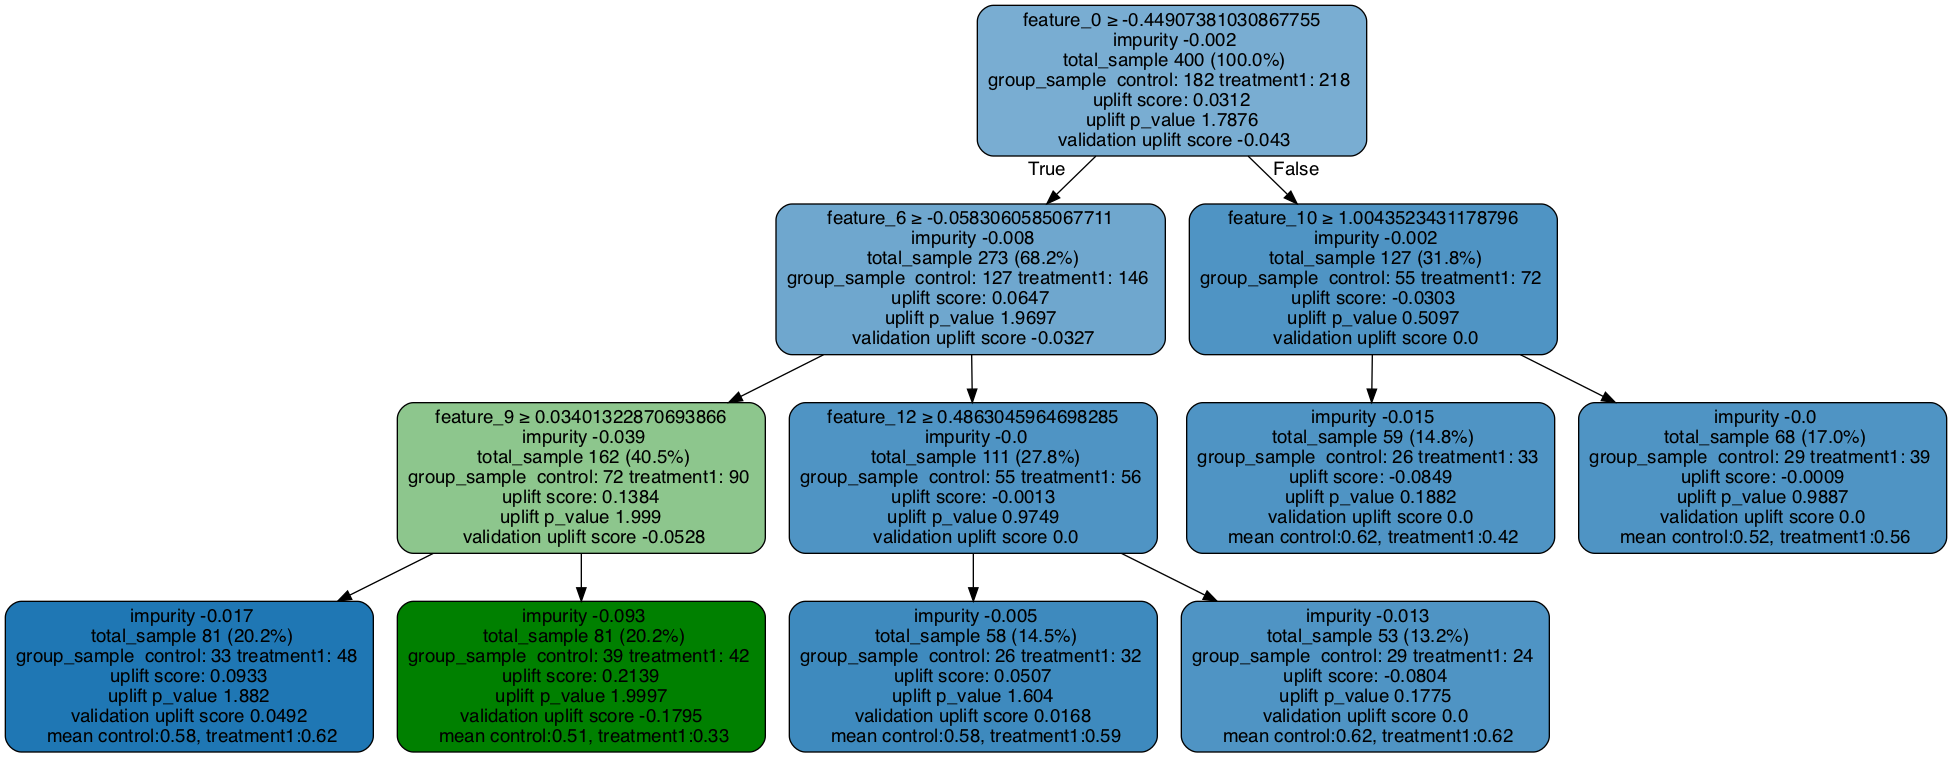
Fill the tree with validation data
[11]:
### Fill the trained tree with testing data set
# The uplift score based on testing dataset is shown as validation uplift score in the tree nodes
uplift_tree.fill(X=df_test[x_names].values, treatment=df_test['treatment_group_key'].values, y=df_test['conversion'].values)

# Plot uplift tree
graph = uplift_tree_plot(uplift_tree.fitted_uplift_tree,x_names)
Image(graph.create_png())
[11]:
One Control + Multiple Treatments
[12]:
# Data generation
df, x_names = make_uplift_classification()
# Look at the conversion rate and sample size in each group
df.pivot_table(values='conversion',
               index='treatment_group_key',
               aggfunc=[np.mean, np.size],
               margins=True)
[12]:
| mean | size | |
|---|---|---|
| conversion | conversion | |
| treatment_group_key | ||
| control | 0.511 | 1000 |
| treatment1 | 0.514 | 1000 |
| treatment2 | 0.559 | 1000 |
| treatment3 | 0.600 | 1000 |
| All | 0.546 | 4000 |
[13]:
# Split data to training and testing samples for model validation (next section)
df_train, df_test = train_test_split(df, test_size=0.2, random_state=111)

# Train uplift tree
uplift_model = UpliftTreeClassifier(max_depth = 3, min_samples_leaf = 200, min_samples_treatment = 50, n_reg = 100, evaluationFunction='KL', control_name='control')

uplift_model.fit(df_train[x_names].values,
                 treatment=df_train['treatment_group_key'].values,
                 y=df_train['conversion'].values)
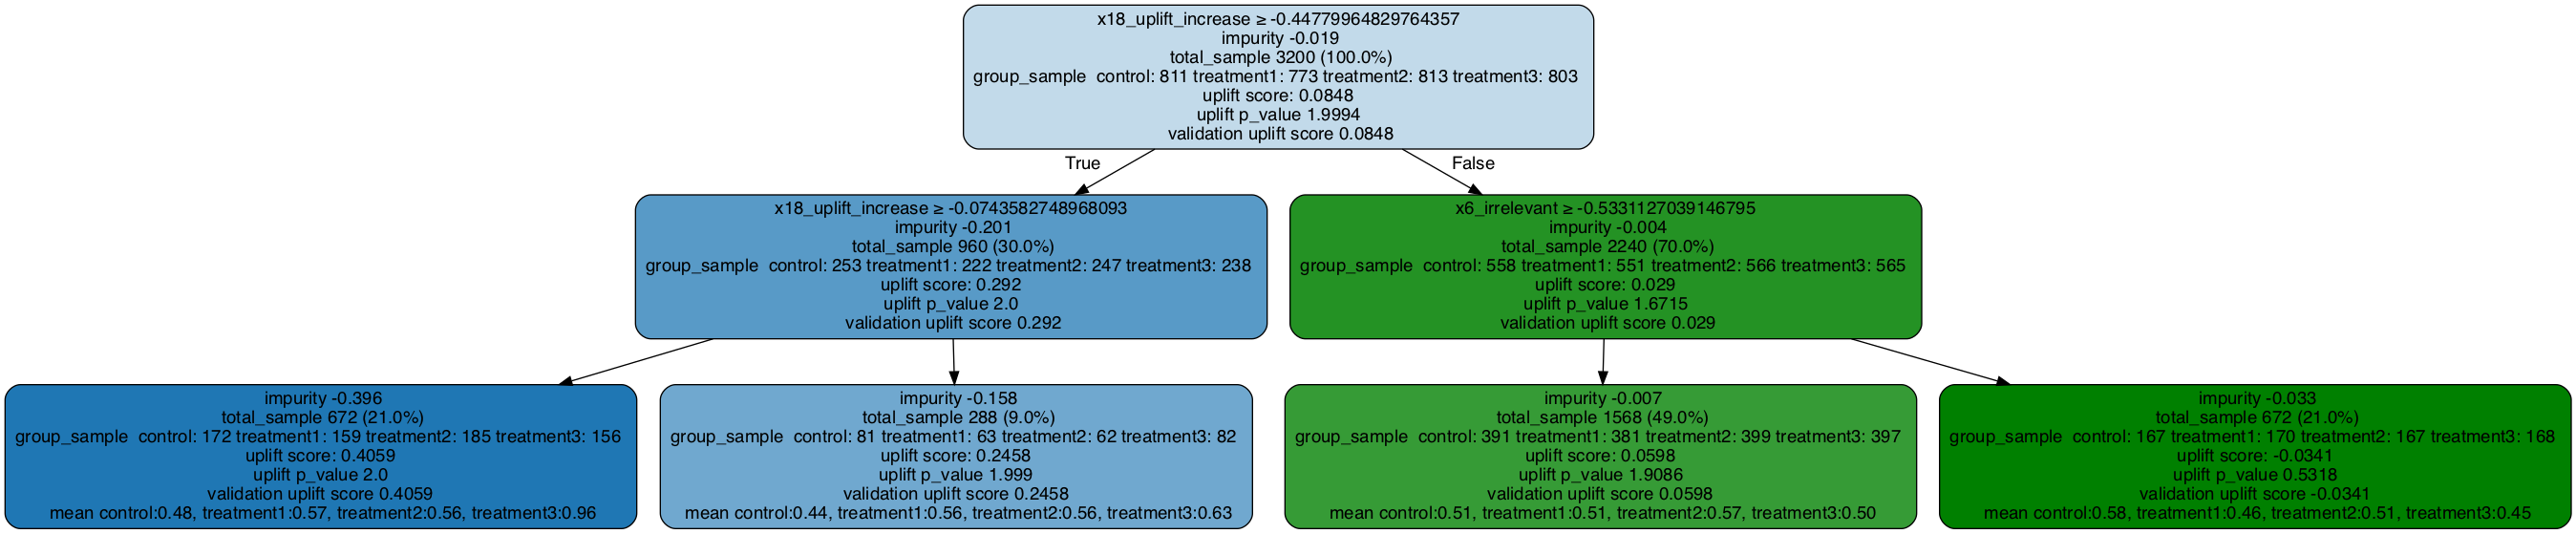
[14]:
# Plot uplift tree
# The uplift score represents the best uplift score among all treatment effects
graph = uplift_tree_plot(uplift_model.fitted_uplift_tree,x_names)
Image(graph.create_png())
[14]:
[15]:
# Save the graph as pdf
graph.write_pdf("tbc.pdf")
# Save the graph as png
graph.write_png("tbc.png")
[15]:
True